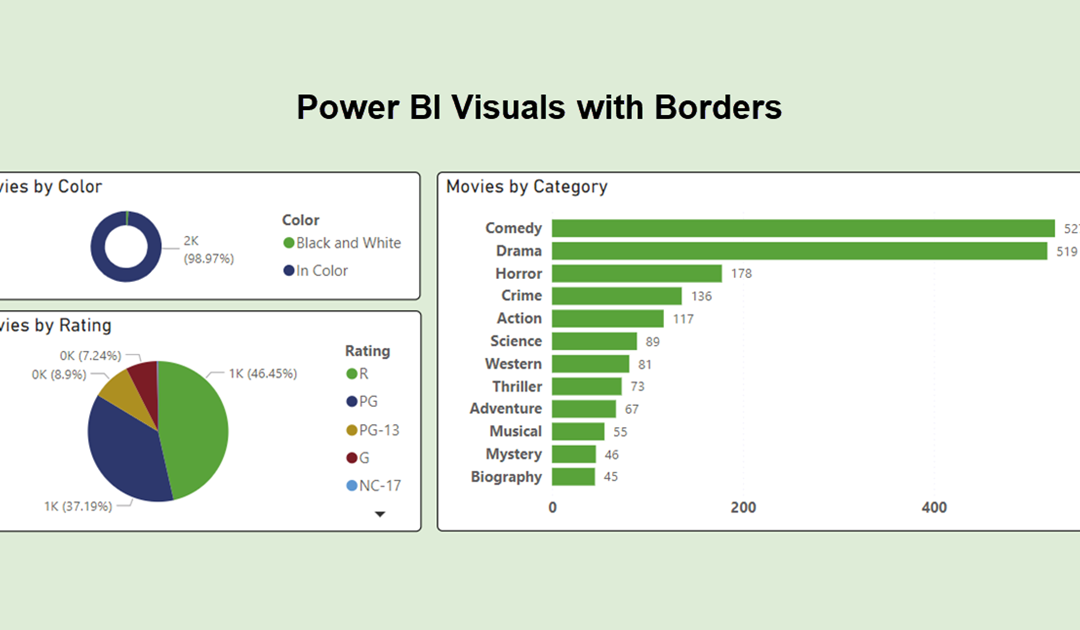
Hello readers in the blogosphere. This is Sir Thomas, your TechMentor. In this blog post I want to show you how to set a default border for your visuals in Power BI.
The good news – Power BI is a powerful free solution
Microsoft Power BI desktop is a free powerful Windows based Business Intelligence reporting tool. Whether your data is in a spreadsheet, a text CSV file, a small local Microsoft Access database, a larger SQL server based database from Microsoft, Oracle, IBM, MySQL, PostgreSQL, Sybase, Teradata, SAP, etc. Microsoft Power BI can help you turn that boring data into useful colorful Business Intelligence Reports with multiple visuals (bar charts, column charts, line charts, area charts, pie charts, tree maps, funnels, maps, gauges, cards, KPIs, and more).
The bad new (before I knew the trick)
As great as Power BI was, I was frustrated. I thought adding a border to my visuals was cumbersome because Power BI did not provide a simple one click solution to turn on a border. Instead I though Power BI forced me to applying the following six-step process shown below. And I almost cursed because the six steps were not intuitive, hard to remember, and tedious because it had to be performed for each and every visual in my report. At least that is what I thought.
Turning on the Visual’s borders – the slow way
- Select the visual.
- In the Visualizations pane, click the Format button.
- Click the General button.
- Expand the Effects area.
- Turn on the Visual border option.
- Optional: Expand the Visual border area and then change the border’s Color, Rounded corners, and/or Width.
- Deselect the visual to see its border.
The solution – How to set a default border
The good news is you do not need to do it the slow way. Instead you can easily set a default border, and then each visual will automatically get that border. How you wonder? By doing these seven steps, just once.
- Go to the View tab in the ribbon.
- Click on the Themes dropdown and select Customize current theme.
- In the theme customization pane, navigate to the Visuals section.
- From the sub-menu, choose Border.
- Turn on the Border option.
- Optional: Change the border’s Color, and set the desired Radius for rounded corners.
- Click Apply.
Problem – Some visuals need their borders reset
After setting the default border, you may find that some visuals still don’t have the default theme. This occurs when rogue visuals are no longer set to use the default. You can fix these by doing the following:
- Select the rogue visual.
- In the Visualizations pane, click the Format button.
- Click the General button.
- Expand the Effects area.
- Click the Reset to default option.
- Deselect the visual to see its border.
Thank you for taking the time to read this post. I hope it will save you lots of time and frustration.
If you have a technology question or a tip or trick you would like us to share in a future a post, please let us know.
Sir Thomas
